Blogs
Blogs  Leap Digest
  Events
  About Us
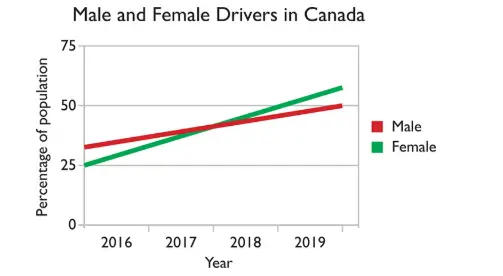
 Male and Female Drivers in Canada Line Graph: PTE Describe Image Question with Sample Answers - Page 2
Your task
Look at the graph below. In 25 seconds, please speak into the microphone and describe in detail what the graph is showing. You will have 40 seconds to give your response.

30 community answers with AI feedback
30 community answers with AI feedback
SCORE 14/16

AI Feedback
AI Feedback
Content:
The response describes the main features of the image accurately and identifies relationships, but lacks some detail in expansion.
Oral Fluency:
The speech is fluent with no disfluencies and a good pace.
Pronunciation:
The pronunciation is good with a high score, but there are some inaccuracies in word accuracy.
SCORE 14/16
AI Feedback
AI Feedback
Content:
The user identified the overall topic of the image and described key elements such as the male and female drivers' percentages over the years. However, some details were inaccurate, and the explanation of relationships between male and female drivers was not fully articulated.
Oral Fluency:
The speech was smooth and natural with a good pace, featuring only minor pauses.
Pronunciation:
The pronunciation was mostly clear with minor errors, allowing for comprehension.
SCORE 14/16
AI Feedback
AI Feedback
Content:
The user identifies the overall topic of the image and describes several key elements, including the percentages of male and female drivers from 2016 to 2019. Relationships between the elements are mentioned, but some details are missing, preventing a full score.
Oral Fluency:
Speech is smooth and natural with a good pace and no significant hesitations.
Pronunciation:
Pronunciation is mostly clear with minor errors affecting some words.
SCORE 14/16
AI Feedback
AI Feedback
Content:
The response accurately describes the main features of the image and identifies relationships between them, although it could expand further on details.
Oral Fluency:
The fluency is excellent, with a good pace and no disfluencies.
Pronunciation:
The pronunciation is generally clear, but there are some inaccuracies in word accuracy.
SCORE 14/16
AI Feedback
AI Feedback
Content:
The user identifies the overall topic of the image and covers most key elements, describing the trends of male and female drivers in Canada. However, some details and relationships are not fully explained, such as the specific percentages and the comparison of growth rates.
Oral Fluency:
The speech is smooth and natural, with no noticeable hesitations or disruptions.
Pronunciation:
The pronunciation is mostly clear with minor errors, allowing for good comprehension.
SCORE 14/16
AI Feedback
AI Feedback
Content:
The response accurately describes the main features of the image and identifies relationships, allowing the listener to build an accurate mental picture.
Oral Fluency:
The fluency is highly proficient, with a smooth delivery and minimal pauses.
Pronunciation:
The pronunciation is advanced, with a high ratio of correct words and syllables, though some minor inaccuracies are present.
SCORE 14/16
AI Feedback
AI Feedback
Content:
The user accurately identifies the overall topic of the image and describes key elements, including the trends in male and female drivers. However, some minor details and relationships between elements are not fully articulated, preventing a score of 6.
Oral Fluency:
The speech is smooth and natural with a good pace, showing no hesitation or disfluencies.
Pronunciation:
The pronunciation is mostly clear with a few minor errors that do not significantly affect comprehension.
SCORE 14/16
AI Feedback
AI Feedback
Content:
The user accurately identified the overall topic and described several key elements, including the male and female driver percentages over the years. However, some relationships and trends were not clearly articulated, which prevented a higher score.
Oral Fluency:
Speech was smooth and natural with no significant hesitation.
Pronunciation:
Pronunciation was mostly clear with minor errors, but overall understandable.
SCORE 14/16
AI Feedback
AI Feedback
Content:
The user identified the overall topic of male and female drivers in Canada and described key trends, including the fluctuation in percentages over the years. However, some minor details were missing, preventing a complete description of all key elements.
Oral Fluency:
The speech was smooth and natural with a good pace, showing no significant hesitation.
Pronunciation:
Pronunciation was mostly clear with minor errors that did not significantly affect understanding.
SCORE 14/16
AI Feedback
AI Feedback
Content:
The user identifies the overall topic of male and female drivers in Canada and describes key elements, including the slopes for both genders and the years represented. However, the explanation of relationships between elements is somewhat vague, missing a more detailed comparison of trends over time.
Oral Fluency:
The speech is smooth and natural with a good pace, showing no disfluencies.
Pronunciation:
The pronunciation is mostly clear with minor errors, but it does not significantly hinder understanding.
How to approach it
- Name the image. Say what type of chart or picture it is and what it measures.
- Give the overview first. State the highest and lowest, or the main idea, before any detail.
- Group, do not list. Cover two or three key points. Never read every number.
- Close with one comparison. End on the biggest contrast or the main takeaway.
Model Answer
which depicts a line graph giving percentages of male and female drivers in the country of canada. what we can observe is in the initial years that is in 2016, there were maximum shares of male drivers with approximately over 25 percentage, whereas what we can observe towards the end of 2019 is female drivers contribute to maximum percentages of over 50 percentage. so what we can see is to recapitulate there is a shift between the genders wherein female drivers have increased over the years.