

What is IELTS Writing Task 1?
IELTS Writing Task 1 is a crucial component of the IELTS exam. The task requires you to analyse and describe visual data or respond to a specific situation in at least 150 words. The IELTS task 1 differs depending on whether you are taking the Academic or General Training version of the test.
- IELTS Academic Writing Task 1: It requires you to describe, summarise, or explain visual information, such as a graph, chart, table, map, process, or diagram. The task typically involves summarising key trends, comparing data, or explaining processes.
- IELTS General Writing Task 1: Here, you are asked to write a letter in response to a given situation. The letter could be formal, semi-formal, or informal, depending on the context. This could include:
- Requesting information
- Making a complaint
- Offering an apology
- Expressing gratitude
Here’s IELTS Writing Task 1 at a glance:
Assessment & Scoring Criteria for IELTS Writing Task 1
IELTS Writing Task 1 is marked based on four key criteria, each contributing 25% to your total score. Below is a breakdown of each criterion:
- Task Achievement: Ensure you answer the question completely by summarising and interpreting the visual data correctly.
- Coherence & Cohesion: Organize your ideas clearly, and use linking words to connect your ideas smoothly so your writing is easy to understand.
- Lexical Resource: Use a variety of words and phrases to describe the data without repeating the same words too often.
- Grammatical Range & Accuracy: Use different sentence structures and maintain correct grammar throughout your writing.
Each of the four criteria is equally weighted and scored out of 9. The average of these four scores determines your overall band score for Writing Task 1.
To achieve a high IELTS Writing band score, you must provide a well-structured response with clear comparisons, precise IELTS writing vocabulary, and accurate grammar. By focusing on each aspect and practising IELTS Writing Task 1 questions regularly, you can improve your performance.
IELTS Academic Writing Task 1: Format
Writing Task 1 Academic in IELTS often presents you with various types of visual data, assessing your ability to interpret and describe visual data, processes, or maps. It requires you to write a report summarising the key information presented in the task.
Let’s explore how to approach these tasks effectively.
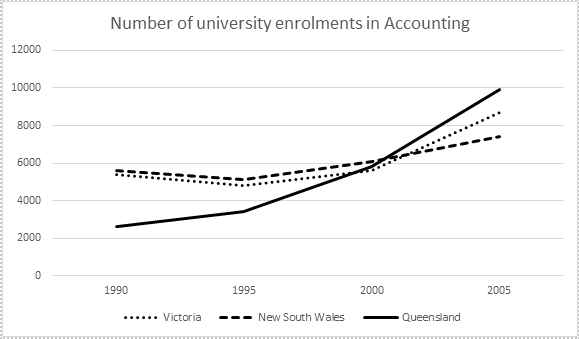
Line Graph
These graphs contain data points connected in straight lines that depict a subject's numbers, percentages, or a specific growth timeline.
How to answer?
- Overview: Begin with a general summary of the overall trend or the most significant changes visible in the graph.
- Identify Key Trends: Highlight major increases, decreases, or fluctuations, and specify when these changes took place over the time period covered.
- Comparisons: For graphs with multiple lines, compare their trends. Note any similarities or differences between the categories represented.
- Data Details: Support your observations by including relevant data points and figures from the graph to make your description more precise.
- Formal Tone: Use formal language and accurate vocabulary to describe the trends. Words like "rose," "declined," "stabilised," and "fluctuated" are useful for describing changes in data.
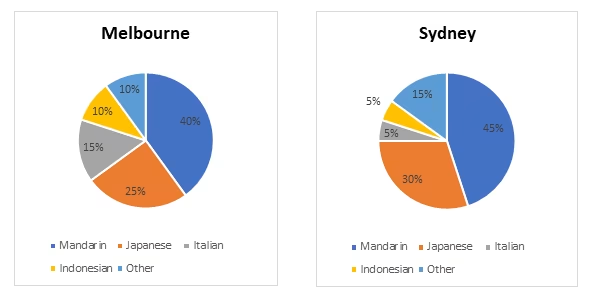
Pie Chart
A circular shape chart divided into parts containing percentages. IELTS commonly presents two graphs and asks you to compare or give an overview.
How to Answer?
- Overview: Start with a general statement summarising the overall distribution or key trends in the chart. Mention the biggest or smallest sections without giving specific data yet.
- Identify Key Proportions: Highlight the most significant segments of the pie chart. Identify the largest and smallest categories, as well as any notable differences between them.
- Comparisons: Compare the different sections of the pie chart. Discuss similarities and differences between the proportions of various categories.
- Data Details: Mention the specific percentages or figures associated with each segment. Make sure to support your observations with relevant data from the pie chart.
- Formal Tone: Use formal and precise vocabulary when describing proportions, such as "accounts for," "represents," "comprises," or "constitutes." Avoid informal phrases like "big chunk" or "small part."
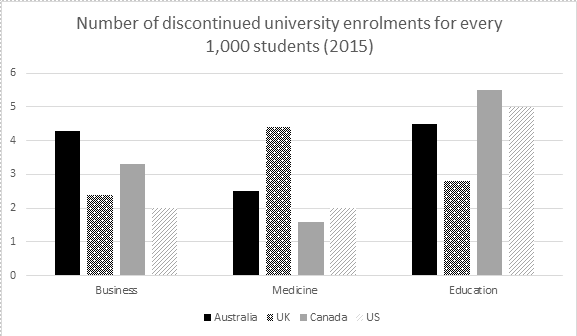
Bar Graph
These charts contain rectangular boxes whose length/height depicts a value. These graphs can be presented in a linear (values in ascending or descending order) or non-linear (values in random order) form.
How to Answer?
- Introduction: Start by paraphrasing the question. Mention what the bar graph shows, including the key categories, time period (if relevant), and units of measurement.
- Overview: Give a general summary of the main trends or comparisons in the graph. Highlight the largest or smallest categories, as well as any noticeable overall trends.
- Identify Key Trends: Look for significant patterns, such as increases, decreases, or stable trends across the bars. Mention any notable changes, if applicable, and group similar categories together for clarity.
- Comparisons: Make comparisons between the different bars. If there are multiple bars representing different groups, compare the differences or similarities between them. Focus on both major and minor differences.
- Data Details: Support your description with specific figures or percentages from the bar graph. Be sure to include important data points without overwhelming your writing with too many numbers.
- Use Formal Vocabulary: Use precise and formal language to describe the data, such as "increased," "decreased," "was higher than," "was lower than," or "remained steady." Avoid casual language and stick to objective descriptions.
Diagram/process
Sometimes, IELTS may ask you to describe a pictorial representation of a step-by-step process. The diagram will consist of a series of steps illustrated in pictures. Remember, each diagram will contain a clear start and end point!
How to Answer?
- Introduction: Begin by paraphrasing the question. Describe what the diagram or process depicts and what it illustrates.
- Overview: Provide a general summary of the overall process or key stages. Highlight any significant features, such as the final outcome or the main steps involved.
- Describe the Steps: Break down the process into clear, logical steps. Describe each stage in chronological order, ensuring that the flow of the process is easy to follow.
- Use Linking Words: Use appropriate linking words to show the progression from one step to another. Words and phrases like "first," "next," "then," "after that," and "finally" help guide the reader through the process.
- Data Details: If applicable, mention any specific data, measurements, or outcomes at each stage of the process to provide more context and clarity.
- Formal Tone: Maintain a formal tone throughout your writing. Use precise vocabulary relevant to the process, such as "purification," "treatment," "filtration," "sedimentation," and "disinfection."
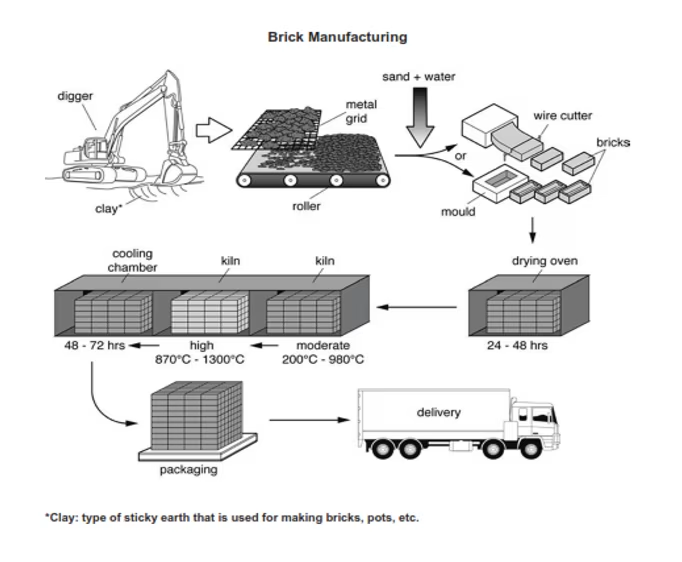
Table Chart
Analysing a table is straightforward; each row and column corresponds to a set containing a category (such as age, time, place) and its data.
How to Answer?
- Introduction: Begin by paraphrasing the question. Describe what the table presents, including the categories, time periods, and units of measurement.
- Overview: Summarise the main trends or notable features of the data presented in the table. Highlight any significant patterns, such as the highest or lowest figures or any trends observed.
- Identify Key Data: Focus on the most important data points. Highlight key figures that stand out and provide context for these figures, such as increases or decreases in sales.
- Make Comparisons: Compare data across different categories or regions. Discuss similarities and differences in the figures, drawing attention to any significant contrasts.
- Data Details: Use specific figures from the table to support your observations. Reference relevant data without overwhelming the reader with too many numbers.
- Formal Tone: Maintain a formal tone throughout your writing. Use precise vocabulary to describe the data, such as "increased," "decreased," "accounted for," "remained stable," or "varied."
Map
Maps illustrate changes in a specific location over time or compare two different locations. They usually depict developments such as infrastructure changes, land use, or urban expansion.
How to Answer?
- Introduction: State what the maps show and the time periods they represent.
- Overview: Highlight the major changes or differences between the maps.
- Body Paragraphs: Describe the changes in detail, organising your response geographically (e.g., north to south) or thematically (e.g., infrastructure vs. natural features).
- Formal Tone: Maintain a formal style with precise vocabulary, such as "was replaced by," "was constructed," "was expanded," and "remained unchanged" to describe changes effectively.

Remember that sometimes you may also get a combination, such as a pie chart and a bar graph.
Following the instructions, you must write a report of typically 150 words. It’s important to adhere to the word limit and follow the instructions word for word.
List of IELTS Writing Task 1 Categories
Below are the key categories with IELTS Writing Task 1 sample answers for each.
Want to achieve a 7+ band score in IELTS Writing Task 1? Let our Leap Scholar experts guide you to IELTS success with personalised guidance. Join our Free LIVE Masterclass today and start your journey to excellence!